Users
Manual
v 0.1
Table of Contents
I. Intro
GyVe is a visualization program for understanding the distribution of galaxies and clusters. GyVe is a cross platform application written in python that uses TKinter for the user interface and VTK as the visualization back end. GyVe should be portable to any system that runs Python, TKinter and VTK. GyVe is available for download at http://gyve.sourceforge.net/.
II. Getting Started
Installation:
There are 2 ways of installing GyVe, either from a provided installer or from source. Currently, an installer only exists for windows. The installer will install all of the necessary components for GyVe to run, and will download Python 2.4 if it is not already installed.
Installing GyVe from source requires that Python 2.4, VTK and VTK-Python are already installed. GyVe has been installed and run on both Linux and Mac OS X platforms. When setting up GyVe when installing from source, it will also be necessary to set the PYTHONPATH environment variable to point to the /lib directory in the GyVe source. Further instructions will be provided here in the future for installations on these platforms. In the meantime, please contact the authors for additional help if needed.
Running GyVe:
For the windows platform, if GyVe was installed with the installer, GyVe is accessible through the Start menu. It should be located at:
Start -> All Programs -> GyVe 0.1.
The intaller should have taken care of setting up all of the necessary paths and environment variables.
When GyVe has been set up from source, the system must also have Python, VTK, and VTK-Python set up as well. The PYTHONPATH environment variable will need to be set to point to the lib directory in the GyVe directory. Assuming python, VTK and VTK-Python are installed, one possible way to run the program is to set the PYTHONPATH environment variable to lib/, go to the top directory of the GyVe installation and run GyVe with the following command:
vtkpython app/ObservationViewer/ObservationViewer.py
Loading the Data:
GyVe can read two types of files, one for the galaxy positions and another for cluster positions. The format for these files is contained towards the end of this manual. To load galaxy data, go to File -> Load Galaxy Data. To load Cluster position data, go to File -> Load Cluster Data.
III. User Controls:
Mouse Controls:
Rotation:
The image can be rotated with the mouse by pressing and holding the left mouse button.
Panning:
Panning (translation within the focal plane) is accomplished by holding the left mouse button down along with the SHIFT key.
Zoom:
Zoom controls are operated by holding the right mouse button down.
Galaxy Grouping:
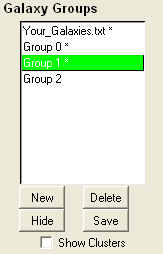
Galaxies can be placed into groups that
are distinctly colored. When loading a galaxy position file, all
galaxies from that file are loaded into a distinct group. Loading
multiple galaxy position files will result in each file getting loading
into its own distinct group. To assign galaxies to a different group,
the target group must exist and be selected. To create a new target
group, use the the New button under the Galaxy Groups box. Once the
target galaxy group has been selected, galaxies can be assigned to this
group by moving the mouse over the intended galaxy in the view window
and pressing the ‘p’ key. An asterisks at the end of a
galaxy group name indicated the galaxies in the group are visible. The
Hide/Show button on the interface toggles the visibility of the galaxy
group.
In the example above, the default galaxy group is “Your_Galaxies.txt”. Three other galaxy groups have been created (Group 0, Group 1, and Group 2). Galaxies selected with the ‘p’ key will be assigned to ‘Group 1’ which is colored Green. Any galaxies that are in Group 2 will not be visible, as indicated by the missing asterisk.
Galaxy Grouping Functions:
| New: | Creates a new galaxy group. This galaxy group is automatically assigned a color according to Ware’s suggestions. |
| Delete: | Deletes the selected galaxy group. |
| Hide/Show | Hides or shows all galaxies contained in the selected galaxy group. |
| Save: | Prints all of the galaxies in the selected galaxy group to file. The output format is the same as the input format. |
GyVe contains functionality to draw curved drop lines from galaxies to its location on a reference axis. This functionality is not exposed on the GUI, but can be accessed through keyboard shortcuts:
| Draw curved drop lines from galaxies in selected galaxy group to: | |
| Min RA axis | 'm' |
| Max RA axis | 'n' |
| Min DEC axis | 'b' |
| Max DEC axis | 'v' |
Camera View Controls:
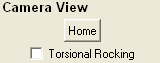
In addition to the camera view controls
provided through mouse interaction, there are two other options. The
‘Home’ button returns the view to the default home view.
The torsional rocking check box enables torsional rocking of the camera
view.
Glyph Size Controls:
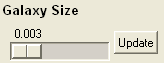
The size of the glyphs representing galaxy and cluster locations can be updated through the use of slider proved GyVe (pictured above).
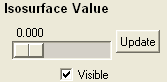
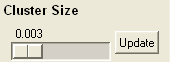
GyVe current implements basic isosurfaces. The controls for isosurface generation is shown above. The visibility of the isosurface can also be toggled through the check box.
V. Input data format
GyVe currently accepts two different input data types. This includes a file containing the position of individual galaxies and a file containing the position of galaxy clusters. The format expected for each of these files is below. Each file is white space delimited (tabs or space). An example of these formats can be found in the documentation section of the sourceforge site for this project. It should also be noted that GyVe actually only uses the RA decimal and DEC decimal columns for determining the RA and DEC position of a galaxy or a cluster.
Galaxy File Format:
Galaxy positions are specified in a whitespace delimited text file. The expected format is a list of lines with, where the lines have the following format. The way this should be interpreted is that each column in the bottom row of the following table represents a column in an input text file:
| Right-Ascension (RA) | Declination (DEC) | ||||||||||
| Hours | Minutes | Seconds | Degrees | Arc minutes | Arc seconds | RA decimal | DEC decimal | RV | Magnitude | Survey String | ID String |
- RA-Hours: Hours of Right Ascension
- Integer
- RA-Minutes: Minutes of Right Ascension
- Integer
- RA-Seconds: Seconds of Right Ascension
- Float
- DEC-Degrees: Degrees of Declination
- Integer
- DEC-Arc minutes: Arc minutes of Declination
- Integer
- DEC-Arc seconds: Arc seconds of Declination
- Float
- RA decimal: Right Ascension as a decimal value
- Float
- DEC decimal: Decimal value as a decimal value
- Float
- RV: Recessional velocity
- Float
- Magnitude: Brightness magnitude
- Float
- Survey String: String identifying survey data came from
- String
- ID String: String identifying galaxy
- String
2 1 27.75 -53 9 27.15 2.024 -53.84 19056.11 15.61 survey_8 galaxy_0
Cluster File Format:
Cluster positions are specified in a whitespace delimited text file. The expected format is a list of lines with, where the lines have the following format. The way this should be interpreted is that each column in the bottom row of the following table represents a column in an input text file:
| Right Ascension (RA) | Declination (DEC) | ||||||||
| ID | Hours | Minutes | Seconds | Degrees | Arc minutes | Arc seconds | RA decimal | DEC decimal | Recessional Velocity |
- ID: ID of cluster
- String
- RA-Hours: Hours of Right Ascension
- Integer
- RA-Minutes: Minutes of Right Ascension
- Integer
- RA-Seconds: Seconds of Right Ascension
- Float
- DEC-Degrees: Degrees of Declination
- Integer
- DEC-Arc minutes
- Integer
- DEC-Arc seconds
- Float
- RA decimal: Decimal value of Right Ascension
- Float
- DEC decimal: Decimal value of Declination
- Float
- Recessional Velocity: Recessional velocity value of cluster
- Float
| Keyboard Commands | |
| Rotation | Left Mouse Button |
| Translation | Left Mouse Button + Shift Key |
| Place selected galaxy into target galaxy group | p |
| Get information on galaxy under mouse cursor | i |
| Draw curved drop lines from selected galaxy group to: | |
| Min RA axis | m |
| Max RA axis | n |
| Min DEC axis | b |
| Max DEC axis | v |